Stranger Things Ratings Graph in R

In this YouTube video I explain how to use the code below to get the IMDB ratings for each episode of Stranger Things and produce this awesome looking graph. Big thanks to Ansgar Wolsing (bydata) who did the heavy lifting,…

R in an Hour

R is a powerful free statistics language that I have used for 27 years. In this video I provide a getting started guide, from what to install, to how to run your first bits of code, where to find the…

How to run EFA & CFA in R
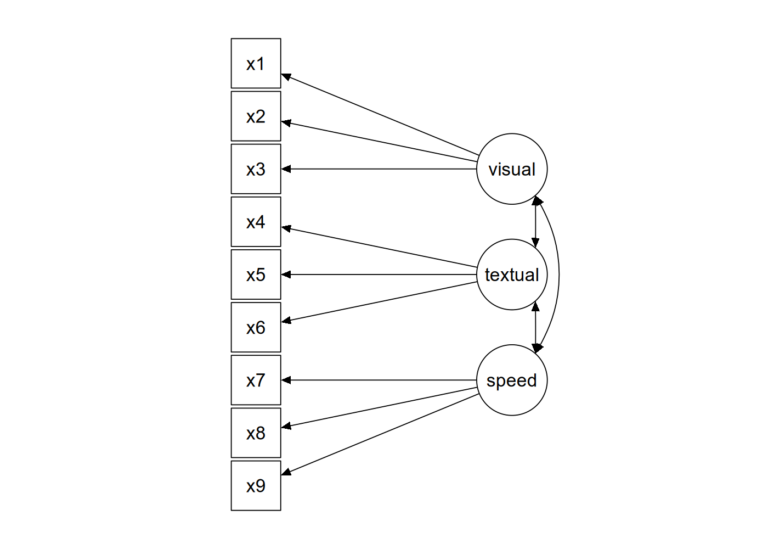
Exploratory Factor Analysis (EFA) and Confirmatory Factor Analysis (CFA) are important techniques that are used extensively in psychometrics and the social sciences. Both EFA and CFA are crucial for understanding relationships between observed variables and underlying constructs. They aid in…

SciSpace Discount Codes

SciSpace (typeset.io) is a fantastic AI powered literature search and research tool. It can find and summarize research articles based on a research question and also has a copilot reading assistant, AI detector, citation generator and a paraphraser. I have…

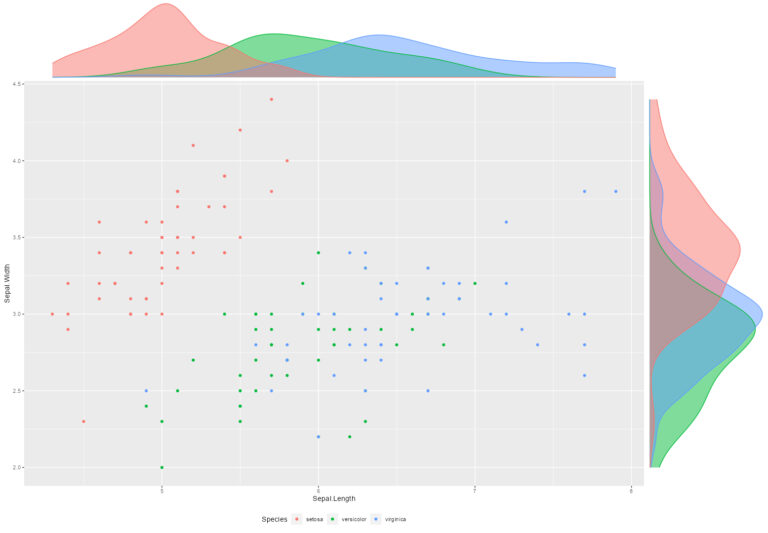
Adding Marginal Density Plots to a Graph in R

In this video I demonstrate how to add marginal density plots to your ggplot2 scatterplots in R using two different R packages – ggExtra and ggside. Using these packages I will show you how to add density curves, histograms, boxplots,…

How to make a Word Cloud in R

In this video, I’ll guide you through using the wordcloud2 package in R. Despite a few minor issues, it comes with a range of unique and practical features that you won’t find in other packages. Throughout the tutorial, I’ll showcase…

Summary Data Viz with gtExtras

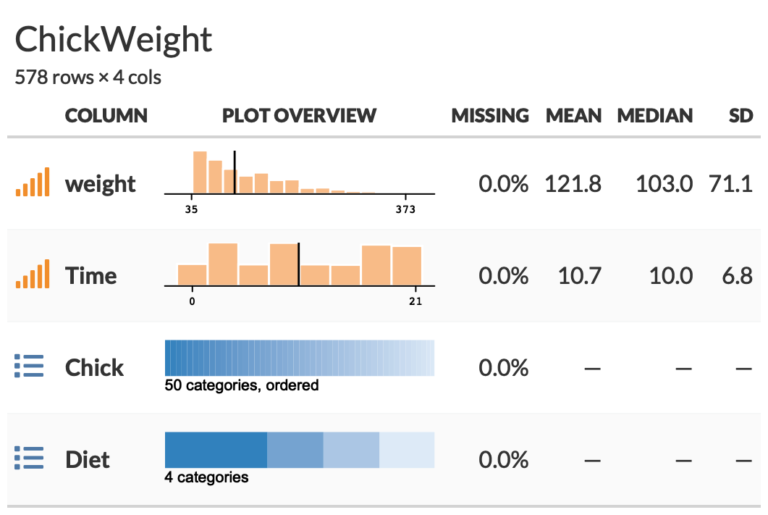
The gtExtra package is an extension of the gt package and has a whole lot of really useful functions for creating summary tables and data visualizations. The code and video below run through a number of examples but one of…

Barbie and Oppenheimer Graph Themes

Want to make your R graphs really stand out? The Theme Park graph themes () give you a range of movie and TV theme sets, including the latest hit movies, Barbie and Oppenheimer. In the video and code below I…

Subset your data in R with the slice function

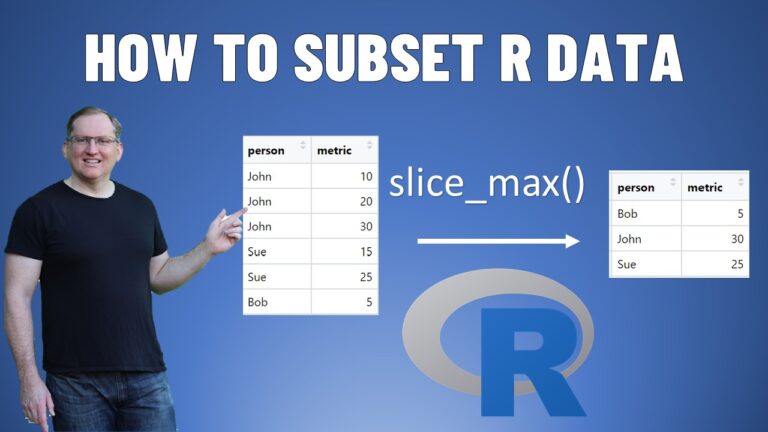
The slice functions from the Tidyverse are a handy set of R functions for taking subsets of your data (like filter but for maximums, minimums, random samples, etc). In this video I demonstrate a number of ways to use slice…