Category R

How to run EFA & CFA in R

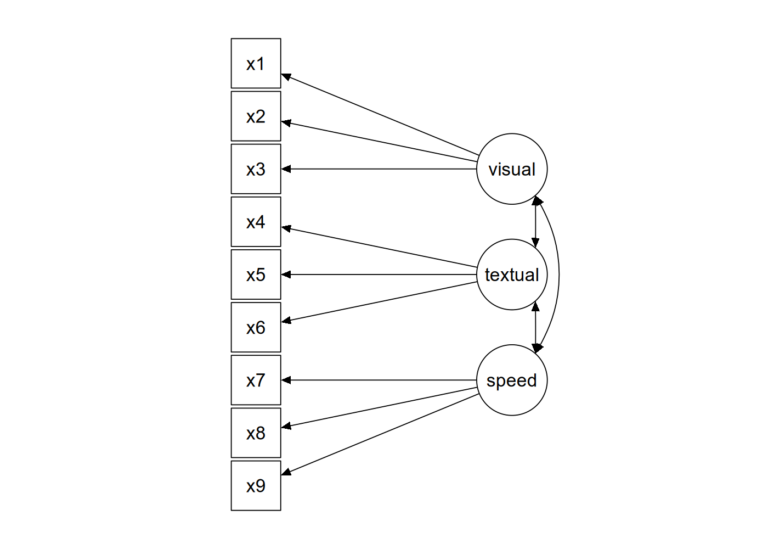
Exploratory Factor Analysis (EFA) and Confirmatory Factor Analysis (CFA) are important techniques that are used extensively in psychometrics and the social sciences. Both EFA and CFA are crucial for understanding relationships between observed variables and underlying constructs. They aid in…

Adding Marginal Density Plots to a Graph in R

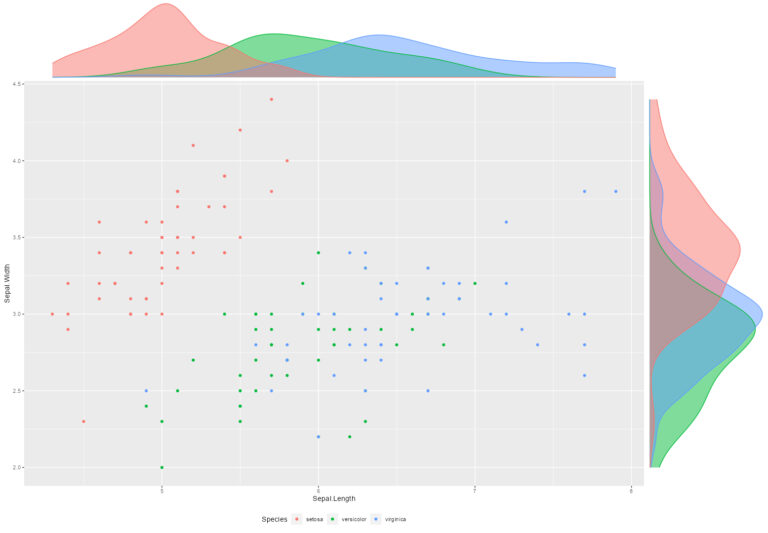
In this video I demonstrate how to add marginal density plots to your ggplot2 scatterplots in R using two different R packages – ggExtra and ggside. Using these packages I will show you how to add density curves, histograms, boxplots,…

How to make a Word Cloud in R

In this video, I’ll guide you through using the wordcloud2 package in R. Despite a few minor issues, it comes with a range of unique and practical features that you won’t find in other packages. Throughout the tutorial, I’ll showcase…

Summary Data Viz with gtExtras

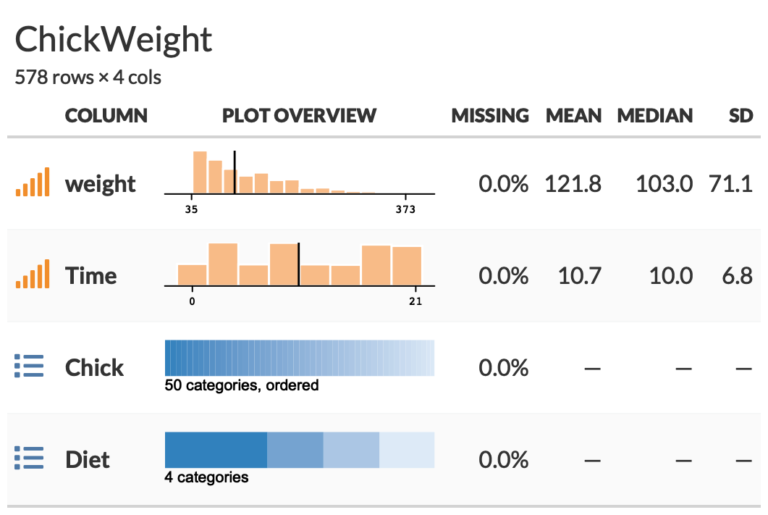
The gtExtra package is an extension of the gt package and has a whole lot of really useful functions for creating summary tables and data visualizations. The code and video below run through a number of examples but one of…

Barbie and Oppenheimer Graph Themes

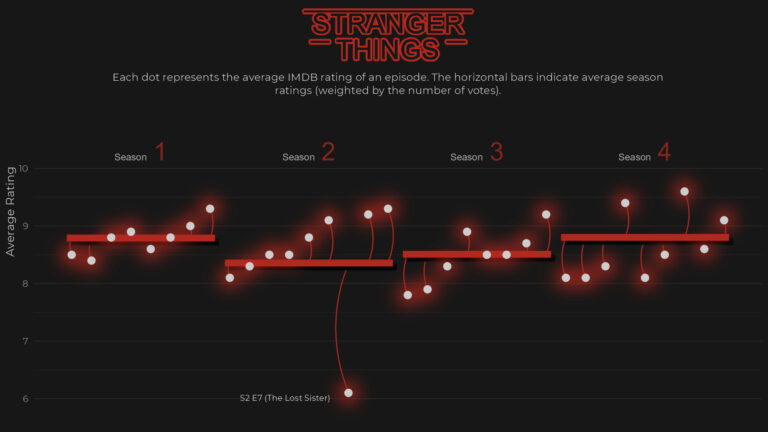
Want to make your R graphs really stand out? The Theme Park graph themes () give you a range of movie and TV theme sets, including the latest hit movies, Barbie and Oppenheimer. In the video and code below I…

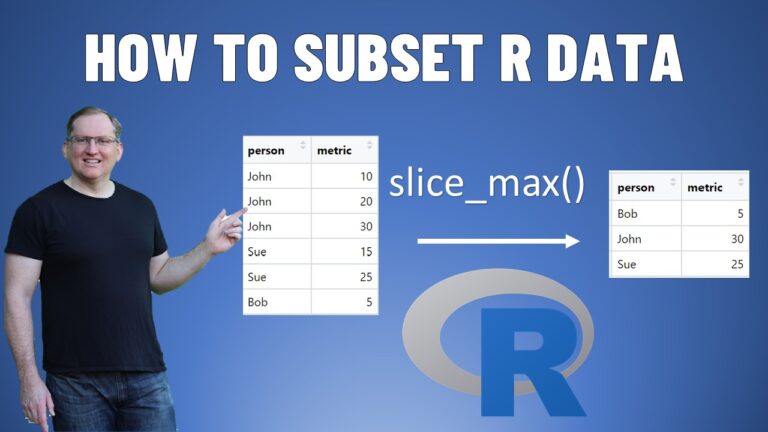
Subset your data in R with the slice function

The slice functions from the Tidyverse are a handy set of R functions for taking subsets of your data (like filter but for maximums, minimums, random samples, etc). In this video I demonstrate a number of ways to use slice…

How to Import Excel Sheets to R

There are a number of ways to import Excel sheets into R. My favourite is tidyverse package readxl. In this video I demonstrate a number of tips and tricks to use this package more effectively. Subscribe to stay up to…

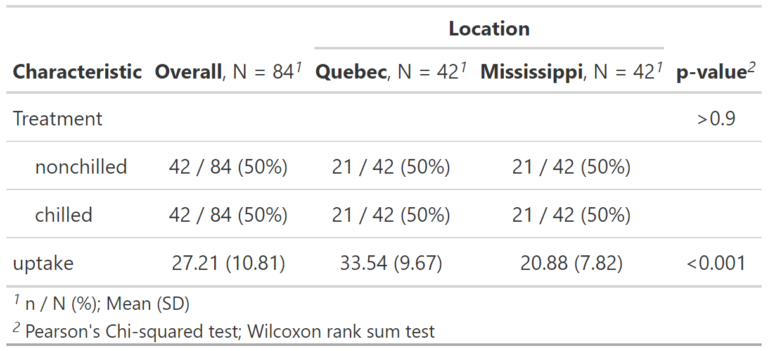
Easy Summary Tables in R with gtsummary

The gtsummary package lets you produce summary statistics for your numeric and categorical variables, formatted into a neat table. You can include p-values for pairwise comparisons and also split your summary across the categories of one of your covariates. Subscribe…

Adding Themes to your ggplots in R

Themes are a convenient way change the appearance of ggplots that you have created in R. In the video and code below I provide examples from a variety packages, showing themes that range from professional and serious, like the Wall…

Raincloud Plots in R

The raincloud plot is a data visualization which is a combination of a density curve of the distribution, and box and whisker plot, and a histogram style dot plot. By showing the density curves these graphs provide the viewer with…