Easy Summary Tables in R with gtsummary
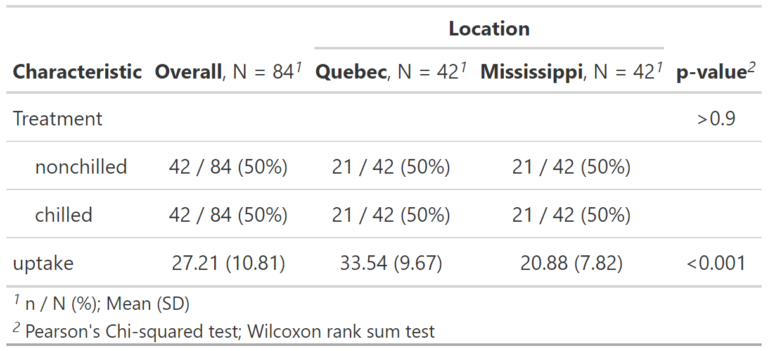
The gtsummary package lets you produce summary statistics for your numeric and categorical variables, formatted into a neat table. You can include p-values for pairwise comparisons and also split your summary across the categories of one of your covariates. Subscribe…