Raincloud Plots in R
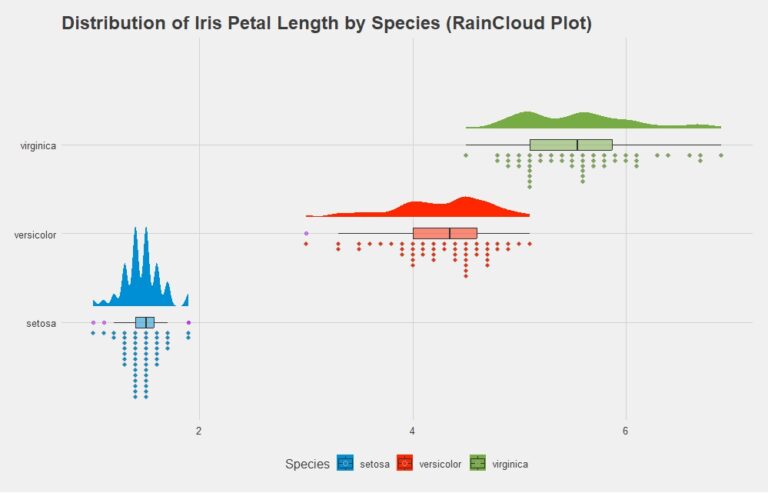
The raincloud plot is a data visualization which is a combination of a density curve of the distribution, and box and whisker plot, and a histogram style dot plot. By showing the density curves these graphs provide the viewer with…