In the following video I demonstrate how to use the cricketdata package for R to download different types of cricket data from espncricinfo and produce some visualizations.
library(cricketdata)
library(tidyverse)
# fetch_cricinfo(): Fetch team data on international cricket matches provided by ESPNCricinfo.
auswt20 <- fetch_cricinfo("T20", "Women", "batting", country="Aust")
IndiaODIBowling <- fetch_cricinfo("ODI", "men", "bowling", country="India")
# fetch_cricsheet(): Fetch ball-by-ball, match and player data from Cricsheet.
wbbl_bbb <- fetch_cricsheet(competition = "wbbl", type = "bbb")
wbbl_match <- fetch_cricsheet(competition = "wbbl", type = "match")
wbbl_player <- fetch_cricsheet(competition = "wbbl", type = "player")
# find_player_id(): Search for the player ID on ESPNCricinfo.
(perry <- find_player_id("Perry"))
EllysePerry <- fetch_player_data(275487, "test", "bowling")
# fetch_player_data(): Fetch individual player data on international cricket matches provided by ESPNCricinfo.
EllysePerry <- fetch_player_data(275487, "T20", "batting")
# Analysis examples
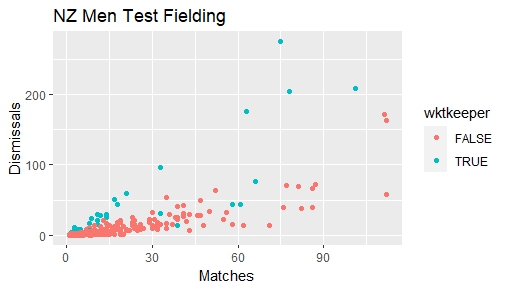
NZfielding <- fetch_cricinfo("Test", "Men", "Fielding", country = "New Zealand")
NZfielding %>%
mutate(wktkeeper = (CaughtBehind > 0) | (Stumped > 0)) %>%
ggplot(aes(x = Matches, y = Dismissals, col = wktkeeper)) +
geom_point() +
ggtitle("NZ Men Test Fielding")
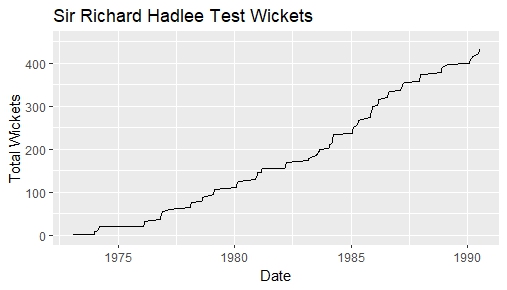
find_player_id("Hadlee")
SirRichard<-fetch_player_data(37224, "test", "bowling")
ggplot(SirRichard, aes(x = Date, y = cumsum(coalesce(as.numeric(Wkts),0)))) +
geom_line(size = 0.5) + scale_y_continuous(limits = c(0, 450)) +
ggtitle("Sir Richard Hadlee Test Wickets")+xlab("Date")+ylab("Total Wickets")