Month January 2023

Raincloud Plots in R
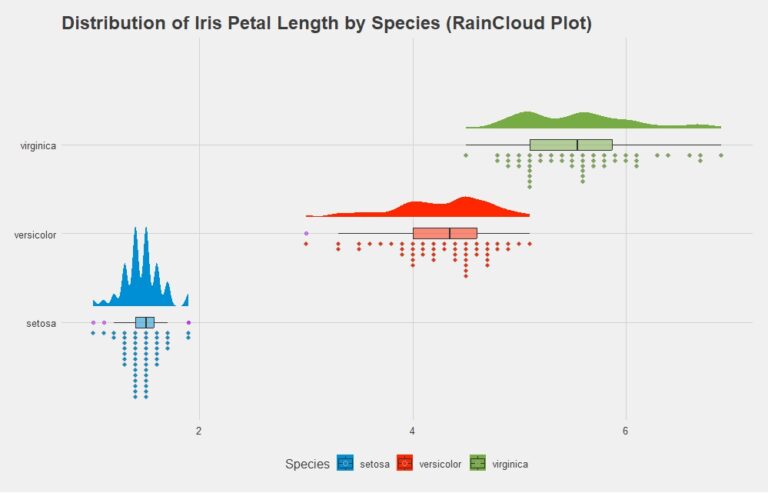
The raincloud plot is a data visualization which is a combination of a density curve of the distribution, and box and whisker plot, and a histogram style dot plot. By showing the density curves these graphs provide the viewer with…
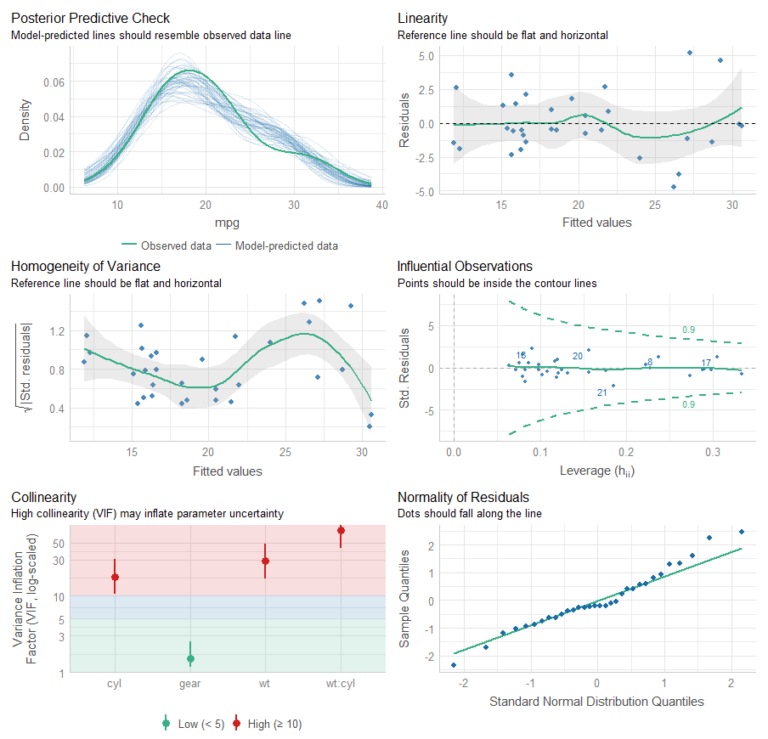
Beautiful Regression Assumption Plots in R

The performance package in R lets you produce regression assumptions tests and plots. In this video I use the performance package in R to produce a set of beautiful and useful plots to check the assumptions of a linear regression.…

Asking ChatGPT about data science careers

ChatGPT is a chatbot developed by OpenAI that utilizes the GPT-3 (Generative Pre-trained Transformer) language model to generate human-like responses in real-time conversations. It can be used in chat applications or on social media platforms to engage with users and…