The gtExtra package is an extension of the gt package and has a whole lot of really useful functions for creating summary tables and data visualizations. The code and video below run through a number of examples but one of my favourite ones is gt_plt_summary() which will summarize all of the variables in a dataset.

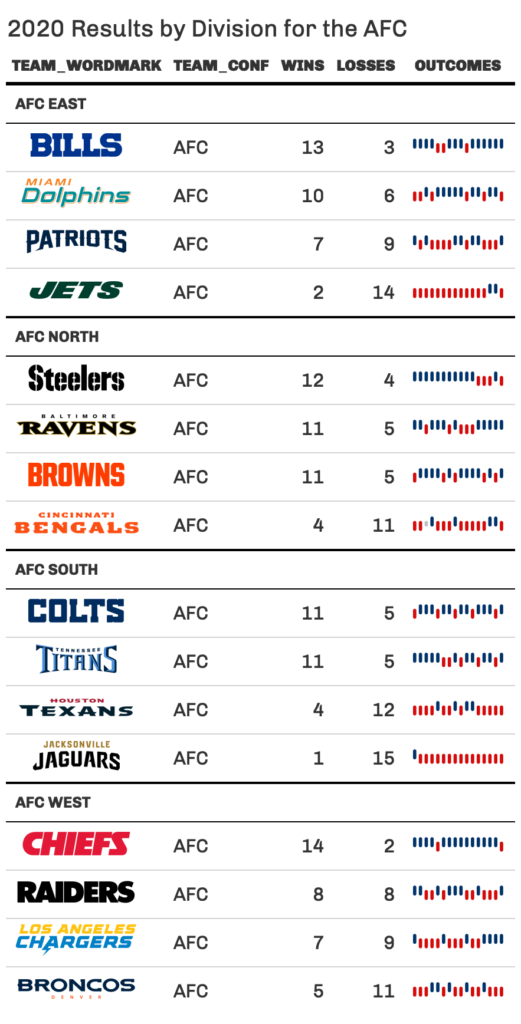
Some of the others include win-loss plots that are very useful for any kind of sports analytics (although I think there could be other commercial and dashboard uses for them too) and the ability to add images to tables to produce something like this:
Subscribe to stay up to date on my latest videos, courses, and content
library(tidyverse)
library(gt)
library(gtExtras)

# quick summary graphs & figures
gt_plt_summary(datasets::ChickWeight)

# highlight a row
head(mtcars[,1:5]) %>%
  tibble::rownames_to_column("car") %>%
  gt() %>%
  gt_highlight_rows(rows = 2, font_weight = "normal")

# add images to a table
teams <- "https://github.com/nflverse/nflfastR-data/raw/master/teams_colors_logos.rds"
team_df <- readRDS(url(teams))
logo_table <- team_df %>%
  dplyr::select(team_wordmark, team_abbr, logo = team_logo_espn, team_name:team_conf) %>%
  head() %>%
  gt() %>%
  gt_img_rows(columns = team_wordmark, height = 25) %>%
  gt_img_rows(columns = logo, img_source = "web", height = 30) %>%
  tab_options(data_row.padding = px(1))
logo_table

# win loss plots
set.seed(37)
data_in <- dplyr::tibble(
  grp = rep(c("A", "B", "C"), each = 10),
  wins = sample(c(0,1,.5), size = 30, prob = c(0.45, 0.45, 0.1), replace = TRUE)
) %>%
  dplyr::group_by(grp) %>%
  dplyr::summarize(wins=list(wins), .groups = "drop")
data_in

win_table <- data_in %>%
  gt() %>%
  gt_plt_winloss(wins)
win_table

# A big example
library(nflreadr)

games_df <- nflreadr::load_schedules() %>%
  filter(season == 2020, game_type == "REG") %>%
  select(game_id, team_home = home_team, team_away = away_team, result, week) %>%
  pivot_longer(contains('team'), names_to = 'home_away', values_to = 'team', names_prefix = 'team_') %>%
  mutate(
    result = ifelse(home_away == 'home', result, -result),
    win = ifelse(result == 0 , 0.5, ifelse(result > 0, 1, 0))
  ) %>%
  select(week, team, win) %>%
  mutate(
    team = case_when(
      team == 'STL' ~ 'LA',
      team == 'OAK' ~ 'LV',
      team == 'SD' ~ 'LAC',
      T ~ team
    )
  )

team_df <- nflreadr::load_teams() %>%
  select(team_wordmark, team_abbr, team_conf, team_division)

joined_df <- games_df %>%
  group_by(team) %>%
  summarise(
    Wins = length(win[win==1]),
    Losses = length(win[win==0]),
    outcomes = list(win), .groups = "drop") %>%
  left_join(team_df, by = c("team" = "team_abbr")) %>%
  select(team_wordmark, team_conf, team_division, Wins:outcomes)

final_df <- joined_df %>%
  filter(team_conf == "AFC") %>%
  group_by(team_division) %>%
  arrange(desc(Wins)) %>%
  ungroup() %>%
  arrange(team_division)

final_df %>%
  gt(groupname_col = "team_division") %>%
  gt_plt_winloss(outcomes, max_wins = 16) %>%
  gt_img_rows(columns = team_wordmark) %>%
  gt_theme_538() %>%
  tab_header(title = "2020 Results by Division for the AFC")