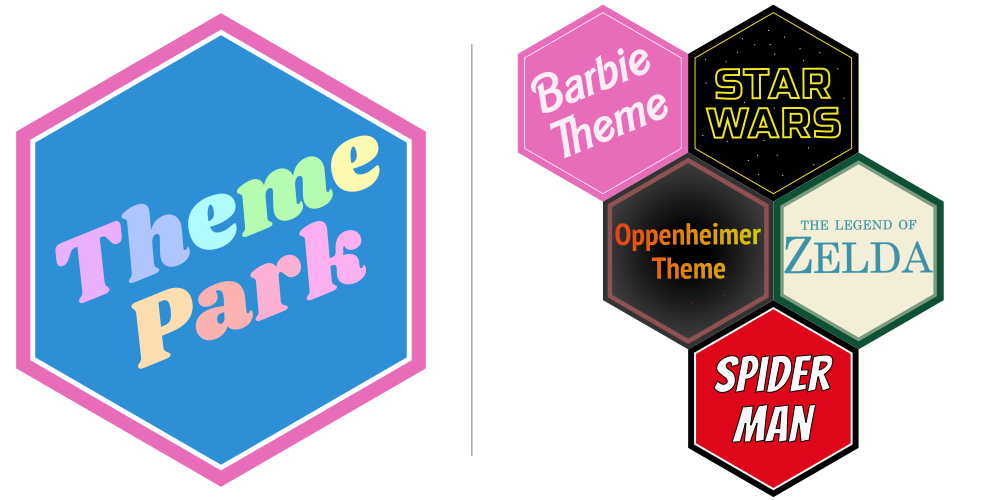
Want to make your R graphs really stand out? The Theme Park graph themes (https://github.com/MatthewBJane/theme_park) give you a range of movie and TV theme sets, including the latest hit movies, Barbie and Oppenheimer.

In the video and code below I show you how to add these themes to your ggplots.
Subscribe to stay up to date on my latest videos, courses, and content
library(tidyverse)
library(devtools)
library(sysfonts)
library(showtext)

# Themes available from https://github.com/MatthewBJane/theme_park

# Barbie colours and fonts
source_url("https://raw.githubusercontent.com/MatthewBJane/theme_park/main/theme_barbie.R")

`X variable` = rnorm(50,0,1)
`Y variable` = rnorm(50,0,1)

ggplot(data=NULL, aes(x = `X variable`,y = `Y variable`)) +
  theme_barbie(barbie_font=TRUE) +
  geom_smooth(method='lm',color=dark_color_barbie, fill = light_color_barbie) +
  geom_point(color = medium_color_barbie) +
  ggtitle('Barbie Scatter Plot')

# Oppenheimer
source_url("https://raw.githubusercontent.com/MatthewBJane/theme_park/main/theme_oppenheimer.R")

ggplot(data=NULL, aes(x = `X variable`,y = `Y variable`)) +
  theme_oppenheimer(oppenheimer_font=TRUE) +
  geom_smooth(method='lm',color=hotflame_color_oppenheimer, fill = light_color_oppenheimer) +
  geom_point(color = flame_color_oppenheimer) +
  ggtitle('Oppenheimer Scatter Plot')