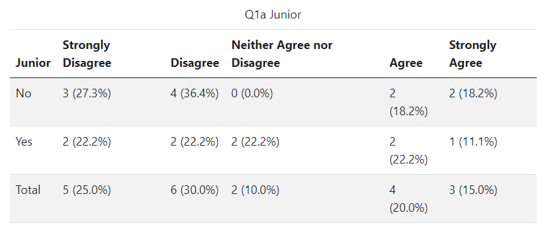
Survey analysis, particularly in psychology, can involve the use of many Likert scale items. The following code and YouTube video show you how to use for loops in R to produce a set of summary tables, with frequencies and percentages for each Likert question crosstabulated with a series of of categorical variables.
Download the R code as a qmd (Quarto) file and the sample data that I used in the video below. If you are new to Quarto you can find out more in my introduction to Quarto YouTube video. Alternatively you can copy and paste the code into an RMarkdown file.
Sign up to my newsletter to get notified of new videos, blog posts, and online courses.